What is the Simple Rating System (SRS)?
The Simple Rating System (SRS) is a metric developed by Pro Football Reference to provide a single number ranking for all teams based on performance against opposition quality. Unlike simple win-loss records, the SRS rating looks past the final result to determine how many points better (or worse) a team is than the league average. It is built on two core components: a team’s average point margin and the strength of their schedule.

The Methodology & Formula
Explore essential data points that reveal valuable trends, performance indicators, and accomplishments, reflecting a robust professional journey and ongoing development.
SRS Rating = Margin of Victory + Strength of Schedule (SOS)
Where Margin of Victory = (Points Scored – Points Allowed) / Games Played and Strength of Schedule is the combined winning percentages of opponents faced this season
Here’s What The Data Says After Week 11:
The tables below present a snapshot of the team’s elite vs non-elite as measured by SRS.
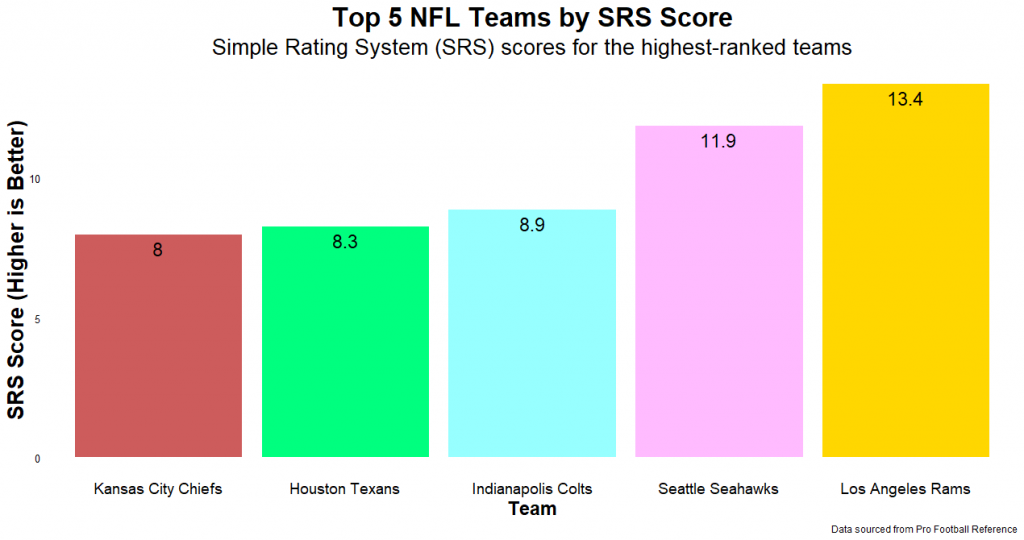
These teams are consistently dominating their opponents and/or have achieved their results against a difficult schedule.
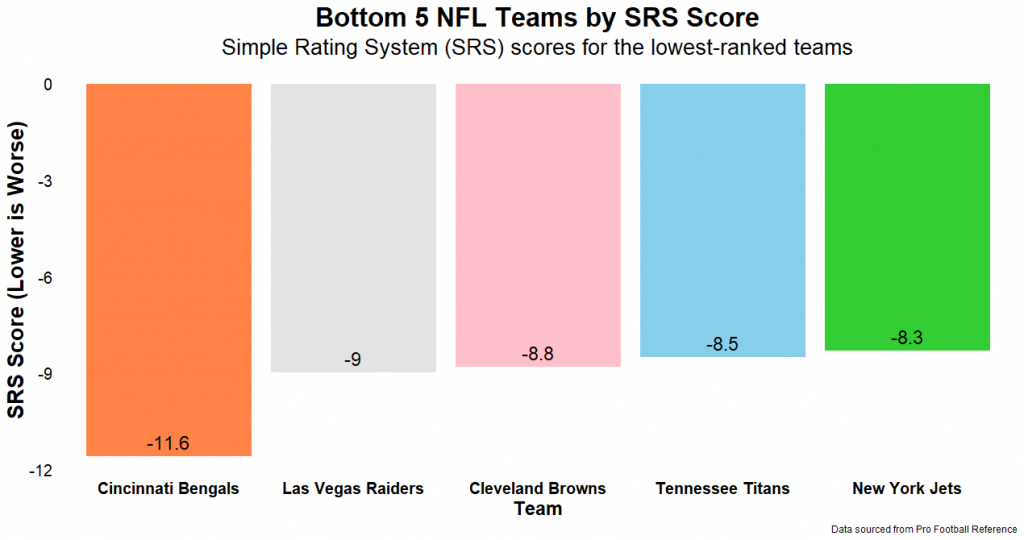
These teams are consistently outscored by their opponents and/or their poor results came against a schedule that wasn’t exceptionally tough.
Key Takeaways:

I am all in on the LA Rams.
Against one of the league’s tougher schedules, this team has delivered a genuinely impressive record and considerable margin of success. They are currently strong contenders for the NFC championship and a prospective favorite for the Super Bowl title.
The Bengals have been a disaster.
Burrow’s injury is a setback, yet the front office continues to struggle with building a consistently competitive team. This all traces back to ownership; talents like Chase and Burrow are effectively being wasted.


The SRS as a tool for assessing team dominance.
As a core analytical tool, the SRS provides a quick, objective assessment of a team’s dominance. It tells you how strong a team is relative to the competition they have faced, making it useful for simple power rankings that are easy for NFL fans to digest.
Appendix
View the source code for these findings here. The code includes a mini tutorial on graph creation. Feel free to use it as a reference for your own projects.
Example:
# Top 5 Teams by SRS Score
top_5_teams_srs <- Week_11_data_cleaned %>%
  arrange(desc(SRS)) %>% # Sort in descending order by SRS
  head(5)                # Select the top 5 rows

# Define the colors for the top 5 teams.
# The names MUST exactly match the team names in the 'Tm' column (e.g., "Indianapolis Colts").
team_colors_top5 <- c(
  "Los Angeles Rams" = "gold",
  "Seattle Seahawks" = "plum1",
  "Indianapolis Colts" = "darkslategray1",
  "Houston Texans" = "springgreen",
  "Kansas City Chiefs" = "indianred")
Leave a Reply