Why Is This Important?
The NFL’s brief 17-game regular season can be deceiving, leading to premature hype or doom for teams based on a limited sample size. Simply put, win/loss records often lie!
I’m diving past the surface-level winning percentages to conduct a mid-season audit: Which teams are outperforming (or underperforming) their true capabilities?
We often hear about future “Strength of Schedule,” but I’m looking backward to assess the quality and sustainability of their current record. I’ll uncover the key factors—like an easy early schedule or injury luck—that inflate or deflate a team’s standing, providing a realistic look at their path forward.
Bottom line: A winning percentage doesn’t tell the whole story. Let’s find out if their success is built to last or destined to crumble!
Methodology
Today, we will be looking at the following:
NFL Team’s Current Winning Percentage vs. Their Opponent’s Winning Percentage
This identifies which teams are performing well against strong competition, accumulating wins against weak opposition, or flat out struggling against strong opposition.
NFL Team’s Points per Game vs. Points Allowed per Game
This metric evaluates which teams appear to be an offensive powerhouse/liability, or defensive powerhouse/liability, depending on their points for vs. allowed output.
NFL Team’s Yards per Game vs. Yards Allowed
This metric supports the previous graphic by evaluating the strength or weakness of a team’s offense/defense in terms of yards gained and/or allowed.
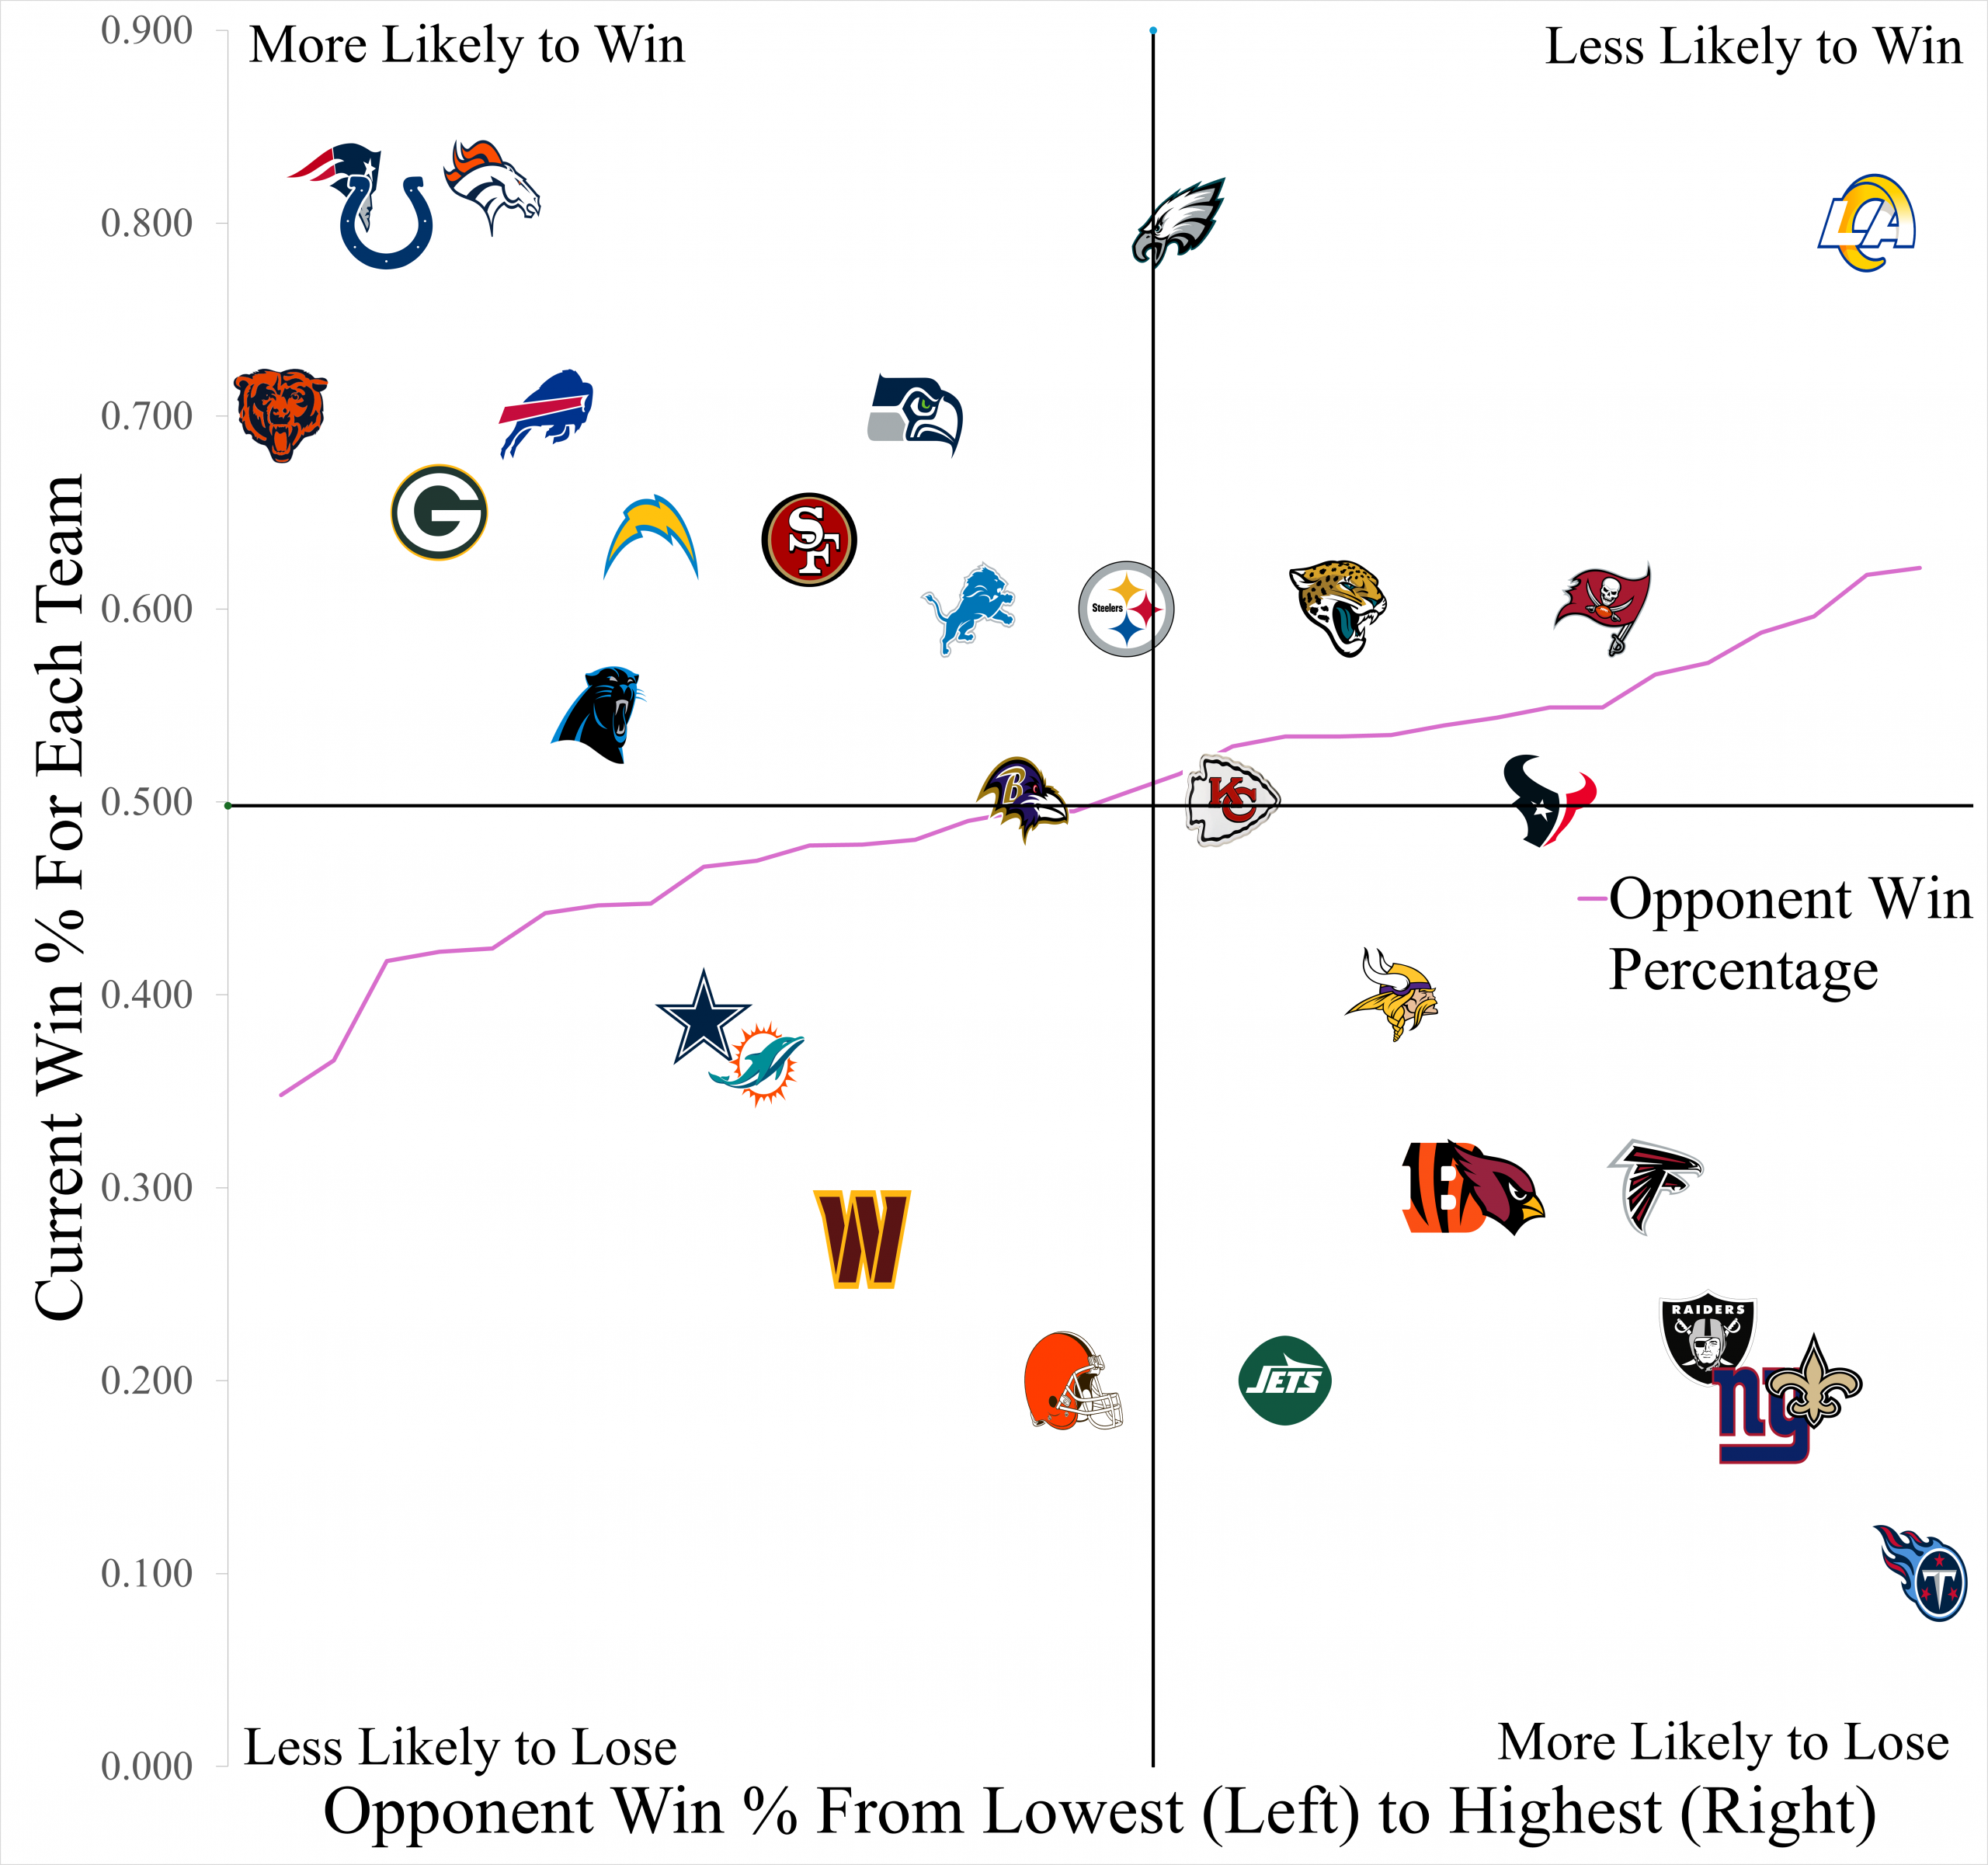
Current Win Percentage vs. Opponent Win Percentage
This complex graph is best understood by dividing it into four quadrants, using the central midpoint as the median for both the x-axis (Opponent’s Average Win Percentage) and the y-axis (Team’s Current Win Percentage). The purple line indicates the opponent’s average Win PCT faced. Teams in the Top-Left have a successful record but against easy competition, suggesting their Win PCT may be less impressive. Conversely, the Top-Right quadrant highlights teams that are truly excelling, achieving high performance against highly competitive opponents. In the bottom half, the Bottom-Left features underperforming teams that are losing games to relatively easy competition. Finally, the Bottom-Right contains teams facing strong opponents and struggling to achieve a high Win PCT.
While the graph provides strong context for all teams, positions near the median are highly fluid. To draw the most dramatic and actionable conclusions, we must focus almost exclusively on the teams in the very far corners. These extreme outliers represent the most significant performance stories, giving us the clearest picture of who is genuinely over- or under-performing their expected ability.
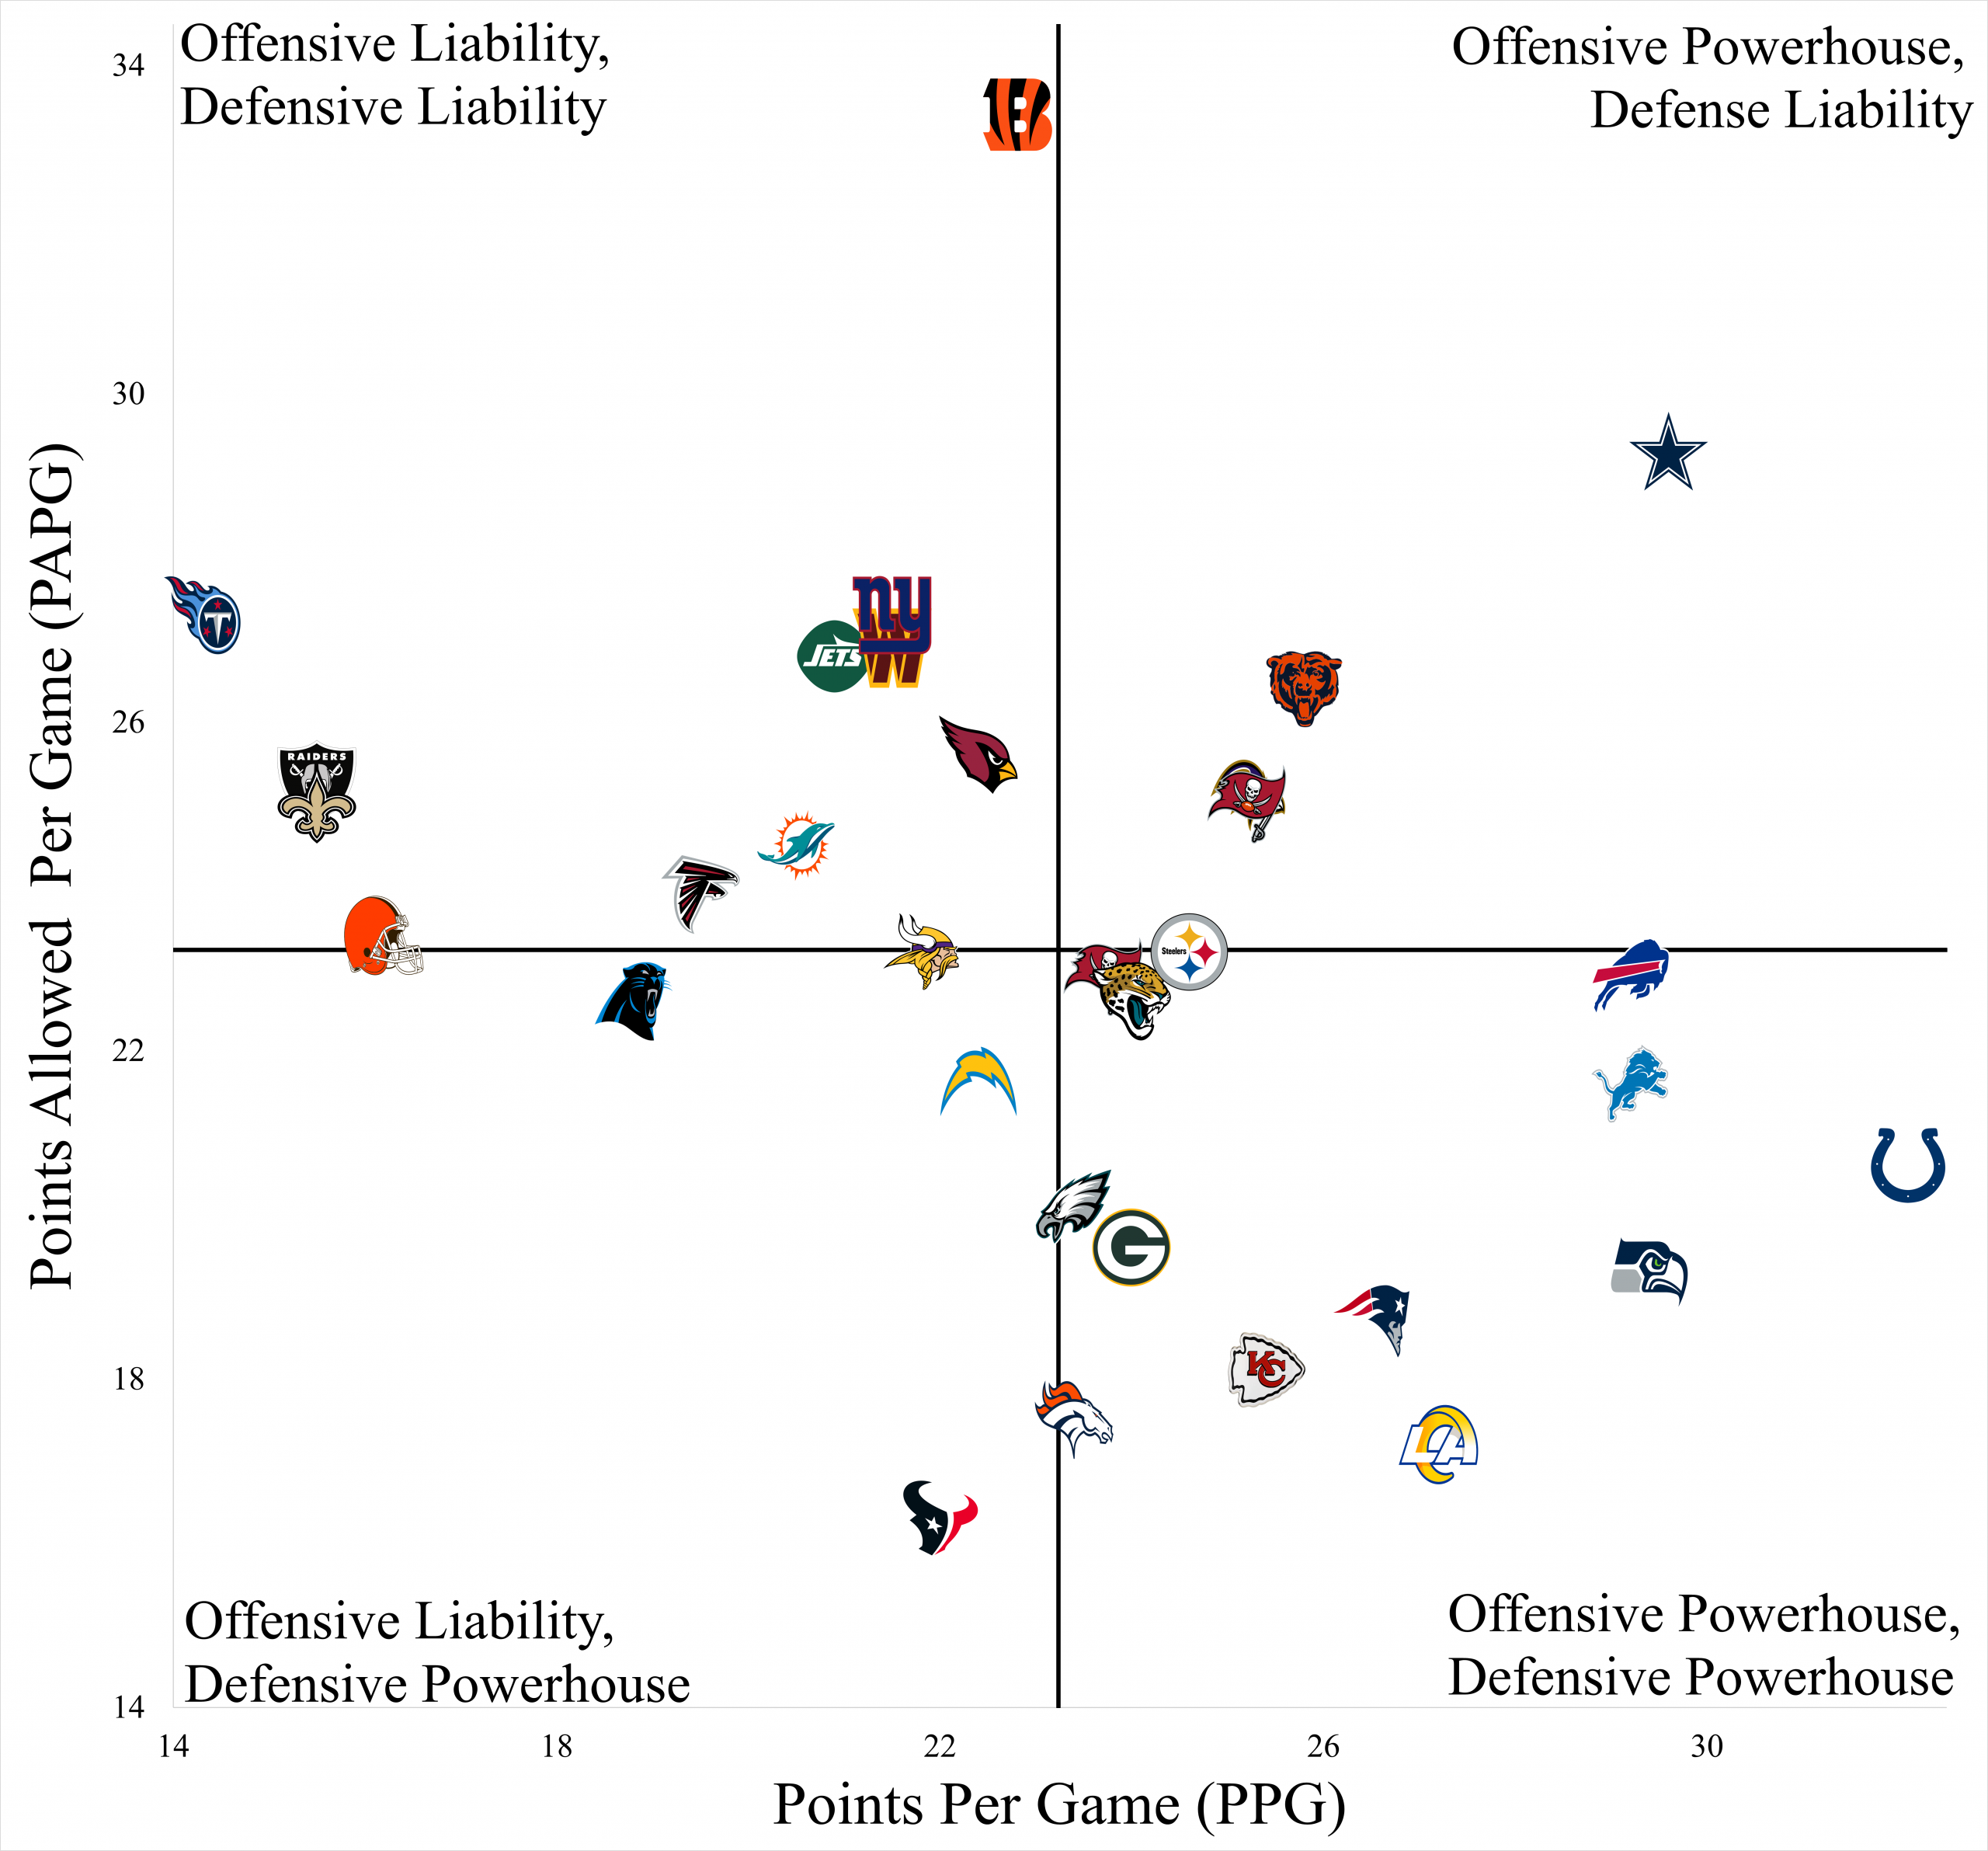
Points Per Game vs. Points Allowed Per Game
This chart dissects every NFL team’s identity using two vital metrics: Points Per Game (PPG) on the x-axis (offense) and Points Allowed Per Game (PAPG) on the y-axis (defense), where the central midpoints define the average performance. The four quadrants illustrate distinct identities: The Bottom-Right quadrant represents the desired Offensive Powerhouse and Defensive Powerhouse, comprising elite, well-rounded contenders who score high and prevent points efficiently. The Top-Right is an Offensive Powerhouse, but Also a Defensive Liability, featuring high-scoring teams that win despite poor defense. Conversely, the Bottom-Left is the Offensive Liability, Defensive Powerhouse, comprising teams with dominant defenses that are overshadowed by struggling offenses. Lastly, the Top-Left signifies the worst struggles as an Offensive Liability and Defensive Liability, where teams both fail to score and give up too many points.
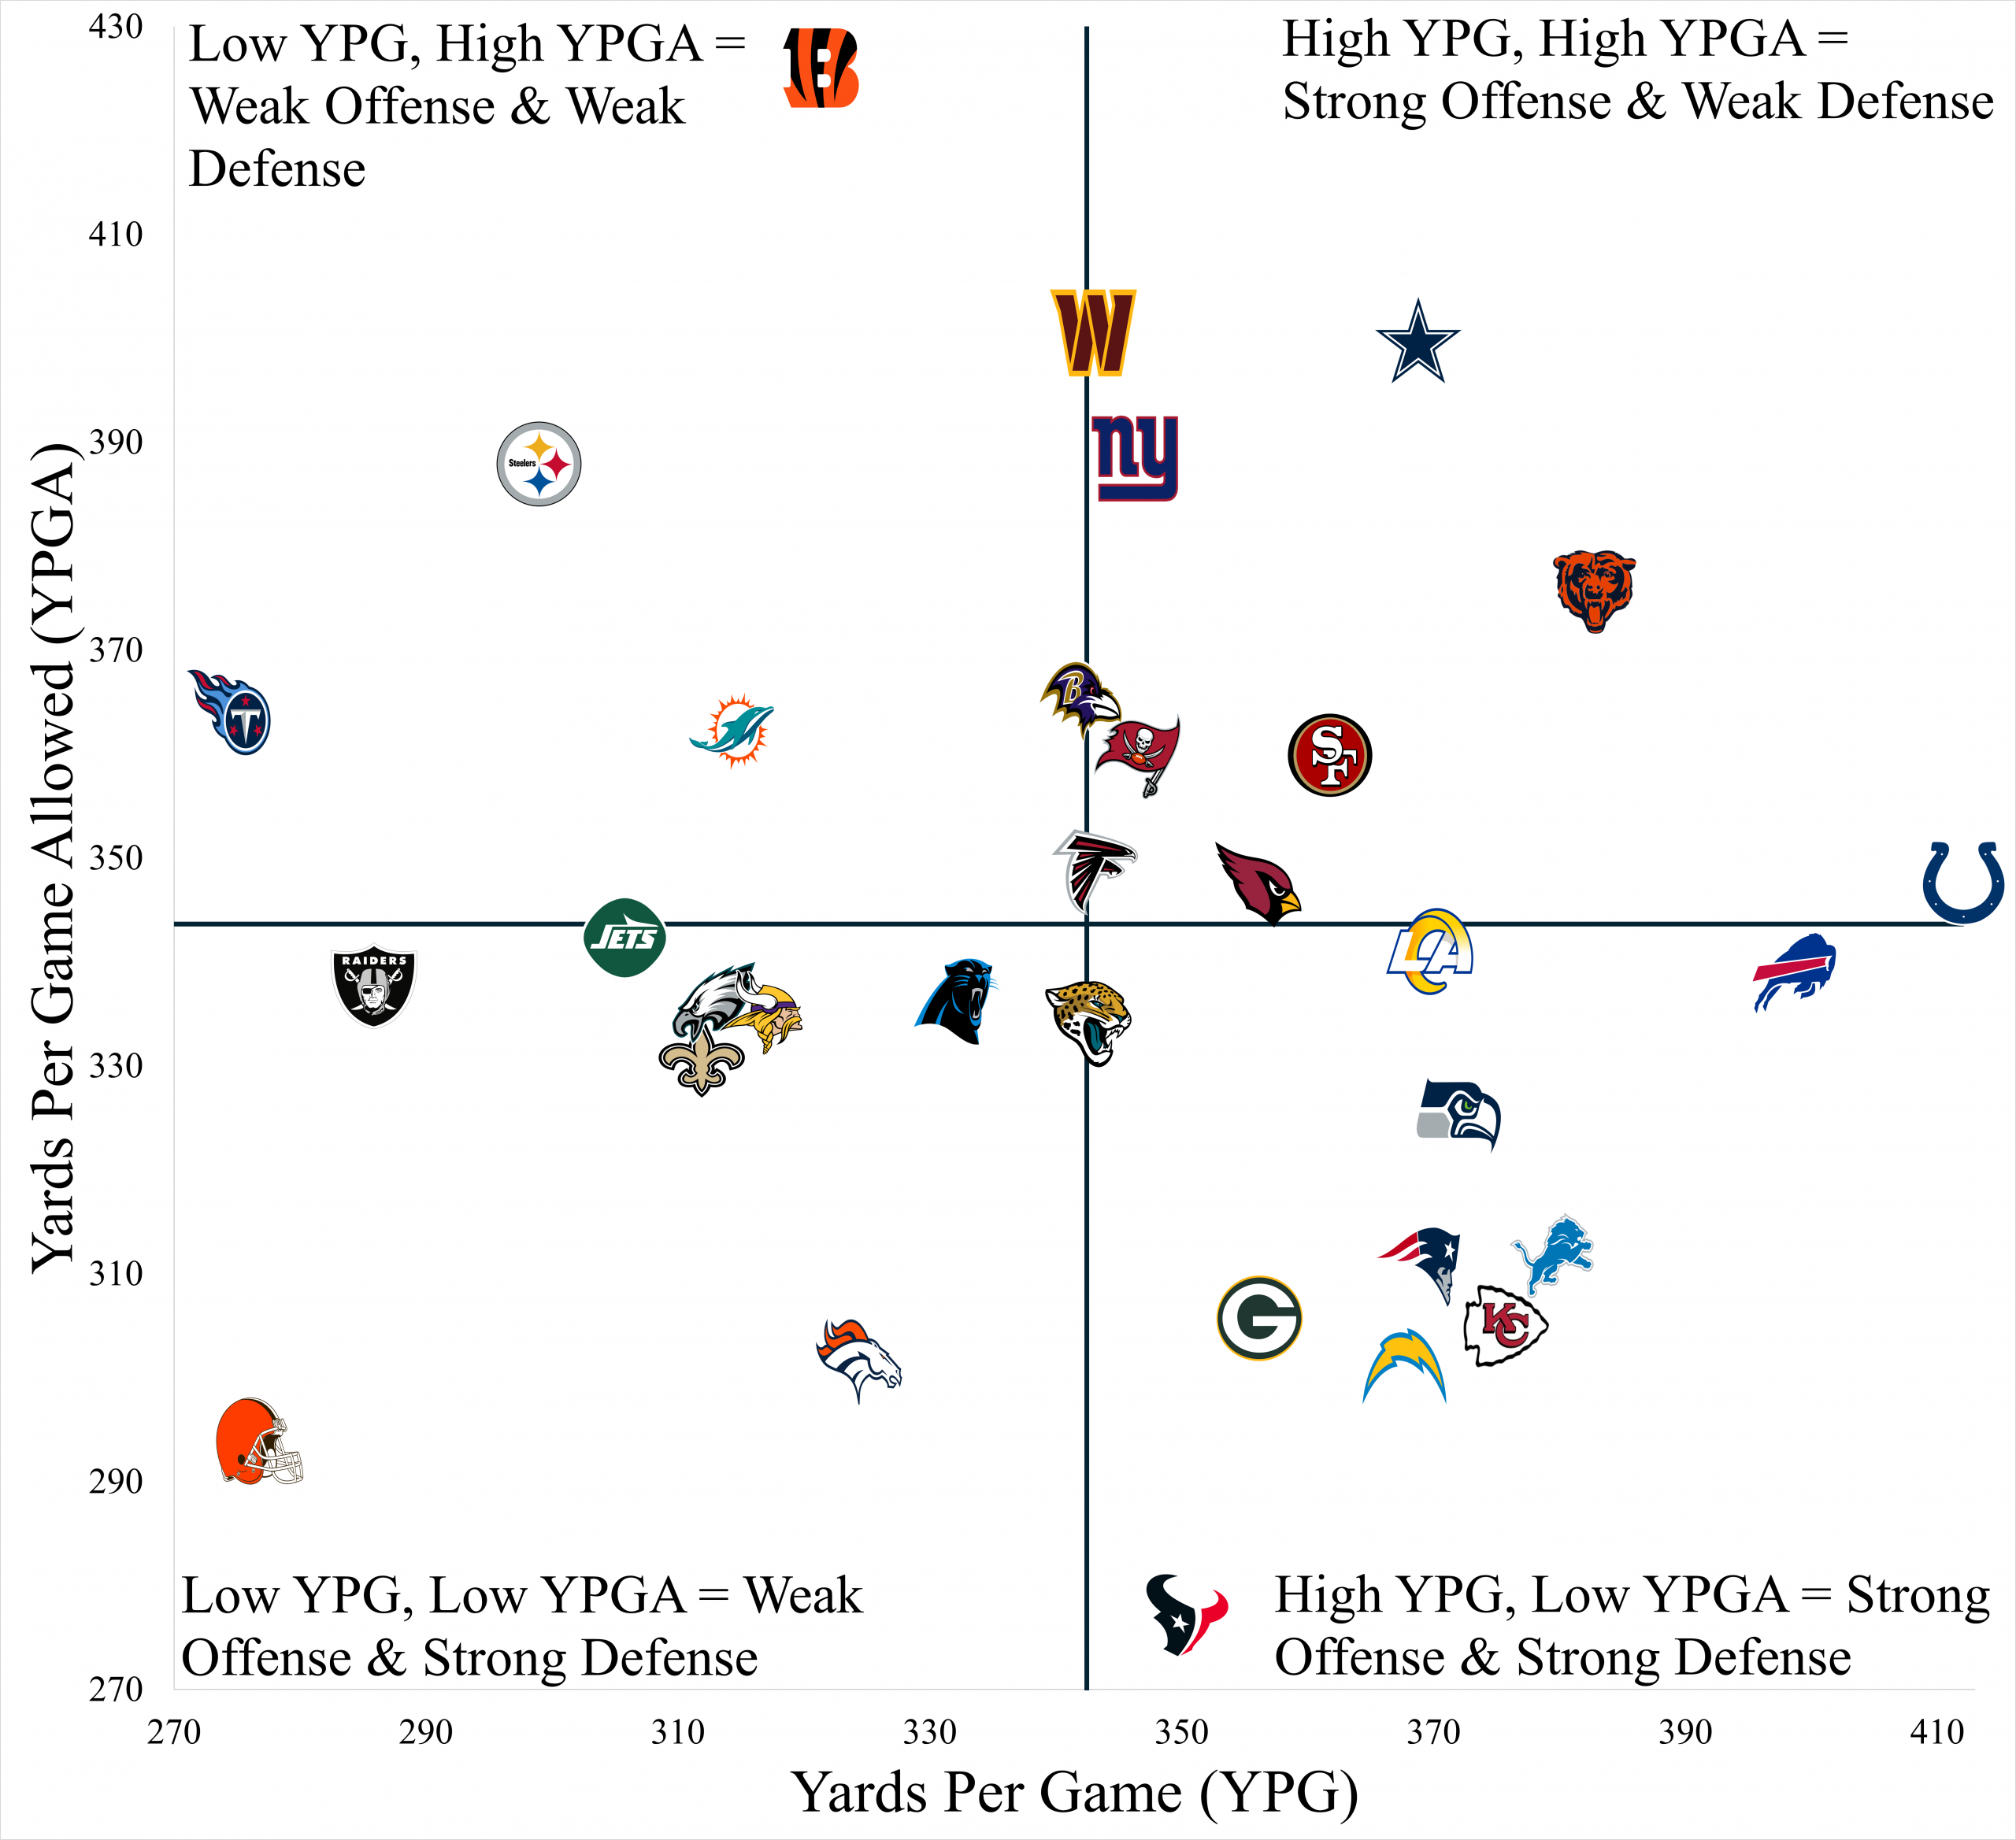
Yards Per Game vs. Yards Allowed Per Game
Following the previous charts I used another four-quadrant structure, but analyzing team efficiency based on Yards Per Game (YPG) on the x-axis (offense) and Yards Per Game Allowed (YPGA) on the y-axis (defense), with central midpoints defining league average. The ideal quadrant is the Bottom-Right, labeled High YPG, Low YPGA = Strong Offense & Strong Defense, representing teams that gain many yards while conceding very few. The Top-Right shows a High YPG, High YPGA = Strong Offense & Weak Defense, featuring teams with powerful offenses that are undone by poor yardage defense. Conversely, the Bottom-Left is Low YPG, Low YPGA = Weak Offense & Strong Defense, identifying teams with stingy defenses that are hindered by offenses unable to gain ground consistently. Lastly, the Top-Left signifies the most inefficient teams: Low YPG, High YPGA = Weak Offense & Weak Defense, where teams struggle both to gain yards and to stop opponents from gaining them.
Takeaways
The Chicago Bears are the first major red flag, having faced the easiest average opponent (lowest Win PCT) and are destined for a drop back to reality. Their defense allows 27 points per game (a high mark against poor competition), which exceeds their 26 points scored per game. While their offense shows promise by ranking top three in yards gained per game, their defense is the clear point of demise, showcasing the seventh-most yards allowed per game. This profile suggests their current success is unsustainable against the tougher schedule they are expected to face.
The Denver Broncos present a profile similar to the Chicago Bears, but with more alarming results. Their offense significantly lags the league, generating very few points and yards per game. While their defense is highly rated, it can only carry them so far. Similarly, the Philadelphia Eagles are facing an unsustainable future. Their underlying metrics suggest they are not the same team that reached the Super Bowl last year; their defense remains strong, but their offense has markedly declined. Although they’ve managed to beat decent teams, these findings point to a performance that is likely to regress.
Conversely, the Los Angeles Rams are positioned as serious NFC favorites and Super Bowl contenders due to their impressive performance against highly difficult opponents. They operate as a true Offensive and Defensive Powerhouse in both points scored versus points allowed. This dominant profile is reinforced by a significant yards-per-game output combined with a very respectable average for yards allowed per game, underscoring their elite, well-rounded play.
While teams like the New England Patriots, Indianapolis Colts, Green Bay Packers, and Buffalo Bills have faced relatively easy competition thus far, their current offensive and defensive output metrics do not point to significant unsustainability. Despite their schedule strength, their balanced performance suggests they are built to last. I would caution against prematurely dismissing any of these teams, as I expect them to remain solid and competitive Super Bowl contenders throughout the entire season.
The Cincinnati Bengals stand out for having what is, by far, the worst defense in the league this season, making them an opponent’s dream matchup and putting them on a trajectory for potentially one of the poorest defensive campaigns of all time. However, on the flip side, no team has yet reached an extreme margin of overall underperformance. Teams like the Cowboys, Dolphins, and Browns, currently hovering near a .500 record, are viewed as volatile and subject to immediate performance shifts that could define the second half of their season.
Conclusion
Given that we are only 10-11 games into the season, it is too early to draw immediate, definitive conclusions from these findings. However, this analysis provides crucial insight to prevent fans and bettors from getting carried away by misleading hot or poor starts. While team comparisons are difficult due to the varying average level of opponents they have faced, this measure successfully highlights the extremities: identifying which teams truly do and do not belong in their current perception. This ability to spot outliers and assess a team’s true capability is the key message and a powerful tool for predicting long-term playoff outcomes.
Leave a Reply