Understanding disparities in competitive balance (CB) across the NHL, NFL, NBA, and MLB is essential for informing strategies that ensure league sustainability. Without CB, the economics of professional sports would lose their uniqueness (Neale, 1956). In this study, I explain why the NBA is the least competitively balanced league in North American sports, followed by the MLB, NFL and then the NHL.
Sport is a business that produces a sport product, and for the business to succeed, that sport product needs to generate revenue (Shonk & Weiner, 2021). The sport industry functions uniquely (Smith & Stewart, 2010), where professional teams rely on the success of other professional teams to produce their primary product for revenue – the sporting event or game (Mason, 1999). In the case of professional football, games need uncertain outcomes to help all clubs survive (Sutton & Parrett, 1992). In conventional markets, the goal is to outperform competitors and become the dominant organization (Neale, 1964). For example, Nike aims to surpass Adidas and dominate the market, potentially at the expense of Adidas’s position. However, the sporting product of each of these businesses differs fundamentally in that the two organizations are required to compete and create a marketable product (Grow, 2015).
For example, the rivalry between Fútbol Club Barcelona and Real Madrid Club de Fútbol, not only depends upon each team winning games, but also on the sustained competitiveness and business health of both organizations to preserve the significance of their encounters. Consequently, to generate revenue, the two teams should be evenly matched to provide entertaining competition to the fans (Plumley et al., 2023). This interdependence makes the economics of professional team sports peculiar (Neale, 1964). Additionally, the production of the main product – the sports event or game – cannot function with a single team (Jones, 1969), making league structure crucial to be able to match teams and achieve competitive parity (Plumley et al., 2023).


An important factor in keeping a league viable is continuous demand from the fans (Boehmer, 2025). Many factors determine demand, but according to Rottenberg (1956), competitive balance (CB) is the most important concept in league structure to help maintain demand. CB is defined as “the degree to which teams in a sports league have relatively equal chances of success” (Lenten, 2015, p. 2). Without CB, the economics of professional team sports would lose their uniqueness (Neale, 1964).
An element that makes professional sports games unique is not knowing the result of a match beforehand; this unpredictable feeling brings excitement to the fans (Downward et al., 2009). As stated above, retain interest and increase demand from fans, the results of the match must be uncertain (Rottenberg, 1956). CB helps describe the uncertainty of outcome hypothesis (UoH), which suggests that “sports fans value contests with uncertain outcomes” (Eckard, 2017, p. 1). By promoting CB, leagues can generate uncertainty of outcome, thereby increasing demand from fans in team sports, suggesting that the UoH fosters long-term engagement (Eckard, 2017). When no game result is predetermined, consumers are more willing to pay admission for games (Rottenberg, 1956). If a game’s outcome is perceived as predetermined, attendance will be skewed, which poses a risk for the league to potentially lose spectators long-term (Michie & Oughton, 2004).
The concept of CB has, as a result, been widely investigated (e.g., Bognar et al., 2024; Budzinski, 2014; Coates & Humphreys, 2011; Martinez & Willner, 2017), and research on CB in professional sports has continued to grow (Mondal, 2023). While comprehensive comparisons of leagues have been conducted on the five Asian football leagues (Plumley et al., 2023) and the top five women’s football leagues in Europe (Mondal, 2023), a direct comparative analysis focusing solely on the four major North American leagues, the National Hockey League (NHL), National Football League (NFL), National Basketball Association (NBA), and Major League Baseball (MLB), has yet to be conducted. As previously discussed, leagues need CB to ensure sustainability and maximize revenue. Without a comparative analysis of CB among the NHL, NFL, NBA, and MLB, it is unclear which leagues demonstrate optimal competitive parity; thus, there may be revenue-generating opportunities that league leaders are missing.
In the current study, a quantitative analysis has been applied to address this gap, by examining which of the NHL, NFL, NBA, and MLB is the most competitively balanced. The paper will proceed with a literature review, an outline of the methods used, provision of the results, a discussion of the results, and a conclusion.

Defining and measuring CB is difficult because CB has several dimensions (Daly & Moore, 1981), and the complexities of real-world league structures present measurement challenges when analyzing CB. CB “is like wealth, everyone agrees it is a good thing to have, but no one knows how much [CB] one needs” (Zimbalist, 2002, p. 111). To achieve CB, the uncertainty of the sporting product (i.e., the game outcome) is essential to provide the most certainty that consumers will pay for the game experience (Rottenberg, 1956).
CB is shaped by the current distribution of talent in each league (e.g., NHL) and how readily that talent can change over time (Bognar et al., 2024). A perfectly competitive balanced league is fair (Nagy et al., 2023) and can be seen as every team having a winning percentage of 50% (Vrooman, 2015). However, an equal chance to win is not always seen in every sport (Budzinski, 2014). To get close to reaching an equal chance, North American sports leagues (e.g., the Professional Women’s Hockey League; PWHL, 2025) implement measures such as draft systems, salary caps, and free agency, to achieve true ‘CB’ (Woltring, 2015). In addition to the uncertainty around the interpretation of CB, there have also been disagreements among academics around the methods used to assess CB.
Measuring CB
When measuring CB, it is crucial to understand the differences in league structures. Leagues vary in several ways, but to name a few include: games played per season, revenue generated, and roster sizes. Therefore, when comparing CB, scholars must consider the unique structural characteristics of each league. Table 1 summarizes key structural differences across the four leagues examined in this study.
Table 1
League Differences
| Season | Games Per Season | Playoff Teams | Salary Cap (2023) |
| NHL | 82 | 16 | 81.5$ (in millions) |
| NFL | 16, 17* | 14 | 182.5$ (in millions) |
| NBA | 82 | 16 | 112$ (in millions)** |
| MLB | 162 | 10, 16, 12*** | 210$ (in millions)**** |
- * NFL introduced 17-game season in 2021 to present
- ** NBA has a soft cap
- *** MLB had a playoff format of 10 teams from 2018 to 2019 and 2021, 16 teams in 2020, and 12 teams from 2022 to present
- ****MLB uses a luxury tax, not a salary cap
Given these structural differences in games played, revenue generated, and roster size, the current study applies measurement techniques previously validated within academic CB literature. Horowitz (1997) identified several methods for measuring CB, including analyzing the ratio of the standard deviation of winning percentages, by using ordinary least squares regression, and by comparing open and closed leagues. Horowitz (1997) demonstrated that the CB of the MLB has generally increased throughout the 20th century; however, the path to being competitively balanced has had numerous detours due to on and off-field changes, suggesting a non-linear CB trend.
From a league organizer’s perspective, measuring CB has been addressed through the implementation of countermeasures to league imbalance. For example, Lee (2020), found an increase in CB in the NHL after unrestricted free agency and a salary cap were implemented. Similarly in basketball, former NBA commissioner David Stern recognized that the NBA was frequently cited as the least competitively balanced league of the four major professional sports in North America (Schmidt & Berri, 2003; Vrooman, 2009; Rockerbie, 2016). As a result, Stern made improving CB a league priority (Woltring, 2015). Specifically, Stern attempted to enhance the league’s CB by developing policies that allowed players to move freely across the league and negotiate contracts with other organizations after their rookie contracts expired (Woltring, 2015). However, imbalance in the NBA’s structure remains (Alwell, 2020).
Without considering these structural league differences and regulatory measures implemented by league organizers, current CB research lacks the required knowledge to determine which of the four major North American sports leagues is the most competitively balanced. Through the current study, which of the NHL, NFL, NBA, and MLB is the most competitively balanced is examined using the Herfindahl-Hirschman Index of Competitive Balance, win dispersion ratio, team dominance, and structural differences (i.e., win-loss percentage, playoff success, and payroll). Each of these methods are outlined next.

Methodology
1
League Concentration
Using the Herfindahl-Hirschman Index of CB (HICB) to assess how evenly distributed success (like wins, points, or championships) is among the teams.
Michie and Oughton (2004)
2
Win Dispersion Ratio
Analyzing the Ratio of Standard Deviation (RSD) where RSD = Actual Standard Deviation (Win %) / Idealized Standard Deviation (Win %)
Fort and Quick (1995)
3
Team Dominance
Two scatter plots showcasing the most and least competitive leagues, based off # of times winning the league and # of times appearing in the final four of the playoffs.
Plumley et al. (2013), Mondal (2023)
4
Benefits of the Draft
Looking at a team’s win/loss percentage in the following 10 seasons after the selection of a top-three draft pick.
Motomura et al. (2016)
5
Success of Lower Seed Playoff Teams
Measuring the historical success rate of lower-seeded teams advancing in the playoffs.
Horowitz (2018)
6
Relationship Between Playoff Appearance and Payroll
Determining a team’s playoff likelihood based on its payroll tier (top 10, middle, or bottom 10)
Longley & Lacey (2012)
To execute all methods in the current study, the following sports data websites were chosen to collect the statistics: (1) Sports-Reference.com (Hockey-Reference, 2014; Pro-Football-Reference, 2014; Basketball-Reference, 2014; Baseball-Reference, 2014); (2) Spotrac.com (2018); (3) Statista.com (1975); and (4) StatMuse.com (2014). These platforms were selected due to their comprehensive long-term statistical databases necessary for the CB methods utilized. Each method is described in detail below.
How To Measure HICB:
HICB scores can be calculated using the formula listed below (e.g., Alwell, 2020; Owen et al., 2007; York & Miree, 2018):
HICB = [HHI / (1/n)] ✕ 100
where the Herfindahl Hirschman index (HHI) is calculated by summing the squares of each participating team’s title share (i.e., proportion of championships won). For a league with n teams, the HHI is determined as:
HHI = S21 + S22 + S23 + …S2n
where S represents each team’s title share.
In a perfectly balanced league of any size, the HICB score equals 100. As the score increases, CB decreases, indicating greater title concentration. When assessing league title share, variations in the number of teams across seasons do not impact the results, as the HHI is normalized by multiplying the number of teams in the dataset (n). To illustrate, consider a hypothetical league with three teams analyzed over nine seasons. Team A has won six championships, Team B has won two, and Team C has won one. The HICB score would be calculated as follows:
HICB 1= {[(6/9)² + (2/9)² + (1/9)²] / [1/3]} ✕ 100
= [0.5061 / (1/3)] ✕ 100 = 151.85
At 151.85, this league lacks perfect CB; however, this score serves as a baseline for comparing other leagues.

HICB Scores For Current Analysis:
Figure 1: HICB scores by league (1975 to 2025)
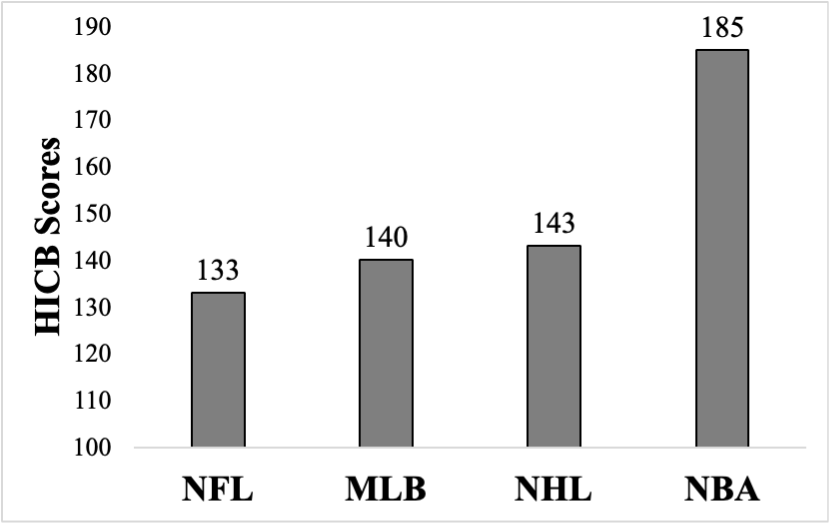
In a perfectly balanced league of any size, the HICB score equals 100. As the score increases, CB decreases, indicating greater title concentration. When assessing league title share, variations in the number of teams across seasons do not impact the results, as the HHI is normalized by multiplying by the number of teams in the dataset (n). The NBA is an outlier in this analysis, with a unique HICB score that is 42.01 points higher than that of the next closest league. This distinct value reveals a smaller number of unique championship winners in the NBA compared to leagues such as the MLB, NHL, and NFL, demonstrating a significant competitive imbalance and a trend toward frequent dynasty formation.
Win Dispersion Ratio

The win dispersion ratio was first identified by Fort et al. (2016) and has become an appropriate metric used to measure CB in North American sports given the rarity of drawn games. RSD is calculated as:

RSD can be calculated by:
RSD = ASD/ISD

where the Actual Standard Deviation (ASD) of win percentages (PCT) at the end of a season is divided by the Idealized Standard Deviation (ISD). The ISD represents the expected standard deviation in a perfectly balanced league and is calculated by 0.5/√n where n is the number of matches played by each team in the league (Fort & Quirk, 1995; Mondal, 2023).
The RSD indicates how close the actual PCT is to the idealized PCT and has been calculated in previous studies (Fort & Quirk, 1995) assessing single-season CB. The closer this ratio is to 1.0, the greater the CB. In the current study, RSD values were calculated for each season from 2014/2015 through to 2023/2024. This chosen period reflects the most recent ten-year data range available for analysis at the time of data collection.
Table 2
Idealized Standard Deviation (ISD) for Each League
| League | Games Per Season | ISD |
| NHL | 82 | 0.55215763 |
| NFL | 16, 17* | 0.125** |
| NBA | 82 | 0.5521576 |
| MLB | 162 | 0.03928371 |
- * NFL introduced 17-game season in 2021 to present
- ** The adjusted NFL ISD for the 17-game season would be 0.121267813
- *** COVID-19 ISD’s were all accounted for
RSD Scores For Current Analysis:
Table 3
Ratio of ASD of Winning PCT / ISD Winning PCT From 2014-15 to 2023-24 Seasons
| Season | NHL | NFL | NBA | MLB |
| 2014-15 | 1.72 | 1.56 | 2.92 | 1.48 |
| 2015-16 | 1.39 | 1.49 | 3.01 | 1.61 |
| 2016-17 | 1.64 | 1.57 | 2.42 | 1.65 |
| 2017-18 | 1.67 | 1.57 | 2.65 | 1.78 |
| 2018-19 | 1.48 | 1.42 | 2.61 | 2.26 |
| 2019-20 | 1.53 | 1.59 | 2.57 | 2.45 |
| 2020-21 | 1.73 | 1.70 | 2.31 | 1.41 |
| 2021-22 | 2.20 | 1.37 | 2.51 | 2.23 |
| 2022-23 | 1.90 | 1.49 | 2.17 | 2.26 |
| 2023-24 | 1.91 | 1.31 | 2.91 | 2.02 |
| Mean | 1.72 | 1.51 | 2.61 | 1.91 |
The NFL demonstrated the most consistency with an average score of 1.51. There was minimal annual variation in the NFL, indicating noteworthy CB in the regular season data. Conversely, the NBA had the poorest level of parity with an average RSD score of 2.61. The most competitive season in the NBA (from the seasons analyzed: 2014/2015 to 2023/2024) was the 2022/2023 season, with an RSD score of 2.17. From the seasons assessed, this was the lowest score for the NBA. By comparison, the NFL never exceeded 1.70, and the NHL only exceeded 2.00 once, with an RSD score of 2.20 in the 2021/2022 season. The MLB had a notably low RSD score of 1.41 in the 2020/2021 season.
Team Dominance Scores For Current Analysis:
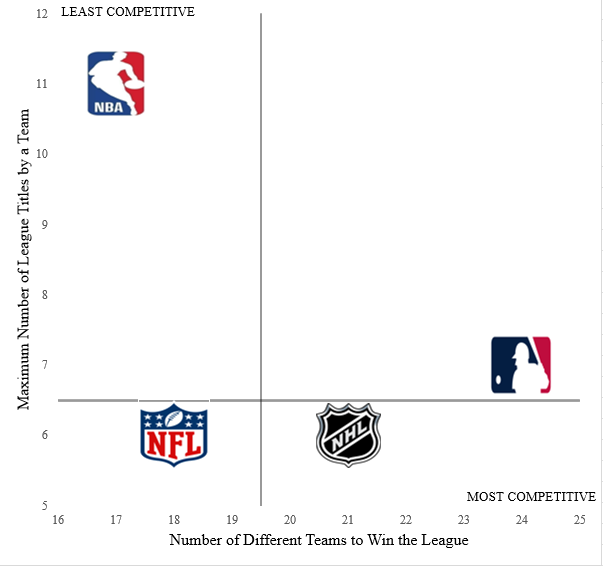
Team dominance “focuses on the extent to which teams persist in winning the league over a number of seasons” (Plumley et al., 2023, p. 435). The analysis plots the number of different championship-winning teams (horizontal axis) against the maximum titles won by any single team (vertical axis) from 1975 to 2025. The axes intersect at median values (x = 19.5, y = 6.5), creating four quadrants: the bottom right represents high CB, while the top left indicates concentrated dominance.
The MLB demonstrates the strongest CB, with 24 different champions across 50 seasons and no team winning more than seven titles (New York Yankees). In contrast, in the NBA, only seventeen different teams have won the league title and eleven of those titles were won by the same team (Los Angeles Lakers). Figure 2 demonstrates the differences in results between each league, showcasing dominance and imbalance in the NBA.
Figure 2: Number Different Teams Winning the League vs. Maximum Number of League Titles by a Team (1975-2025)
Team Dominance Scores For Current Analysis Continued:
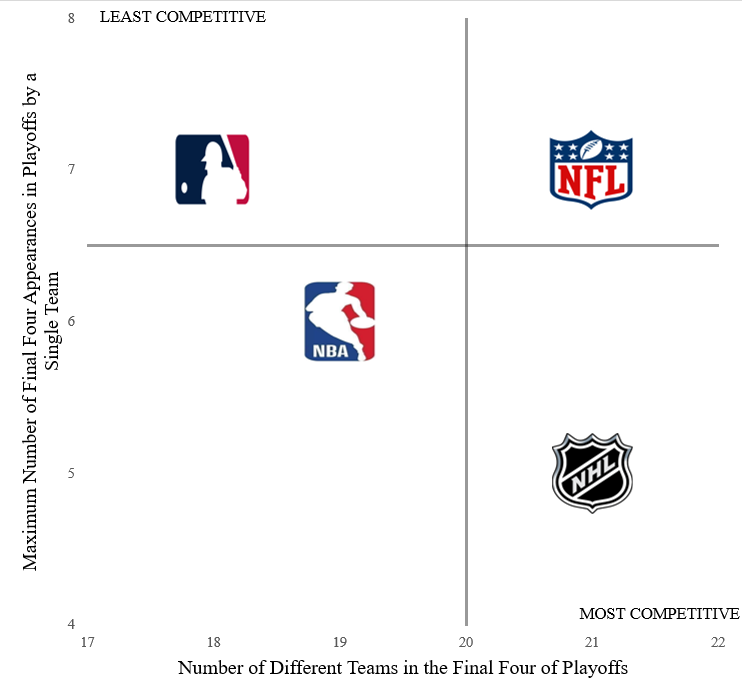
The analysis was then expanded to discover which leagues held the highest the number of different teams to enter the final four of the playoffs (horizontal axis) vs. the maximum number of final four appearances in the playoffs by a single team from 2014 to 2024 (10 seasons) are displayed. The last four playoff teams in each league were selected because they reached the conference finals (the league semi-finals).
The NHL exhibits the strongest playoff balance, positioned in the bottom right quadrant as the league has seen 21 different teams make the final four of the playoffs in the last 10 years, but no single team has appeared in the final four more than five times (e.g., Tampa Bay Lightning). Conversely, the MLB has seen the smallest number of different teams in the final four of the playoffs and tied (with the NFL) for the maximum number of final four appearances by a single team (i.e., Houston Astros). This is noteworthy, since despite the MLB having multiple different league title winners, typically the same teams are competing for that title. At face value, the league looks competitive, boasting a variety of championship winners. However, when you look closely at the playoff structure, you find that the same small group of teams consistently competes for the World Series title. The NFL has the same number of different final four teams as the NHL (21), but dynasties like the Kansas City Chiefs in the NFL have impacted the league’s CB, as they’ve been to the final four of the NFL playoffs in seven of the last ten seasons.
.
.
Figure 3: Number of Different Teams in the Final Four of Playoffs vs. Maximum Number of Final Four Appearances in Playoffs by a Single Team (1975-2025)

Measuring Draft Benefits
Motomura et al. (2016), tested whether it pays to build through the draft in the NBA. Many NBA executives and analysis claim that the best way to content for a championship is to get very high draft picks which require losing many games. I built off this claim by assessing the win-loss PCT of each league in the following ten seasons after selecting a player as a top three draft selection. The teams included in this analysis selected players during the 2011 to 2013 seasons (Table 3).
Table 4
Teams Who Selected in the Top Three of the Draft (2011 to 2023)
|
League |
Year |
1st Overall |
2nd Overall |
3rd Overall |
|
NHL |
2011 |
Edmonton Oilers |
Colorado Avalanche |
Florida Panthers |
|
2012 |
Edmonton Oilers |
Columbus Blue Jackets |
Montreal Canadiens | |
|
2013 |
Colorado Avalanche |
Florida Panthers |
Tampa Bay Lightning | |
|
NFL |
2011 |
Carolina Panthers |
Denver Broncos |
Buffalo Bills |
|
2012 |
Indianapolis Colts |
Washington Commanders |
Cleveland Browns | |
|
2013 |
Kansas City Chiefs |
Jacksonville Jaguars |
Miami Dolphins | |
|
NBA |
2011 |
Cleveland Cavaliers |
Minnesota Timberwolves |
Utah Jazz |
|
2012 |
New Orleans Pelicans |
Charlotte Hornets |
Washington Wizards | |
|
2013 |
Cleveland Cavaliers |
Orlando Magic |
Washington Wizards | |
|
MLB |
2011 |
Pittsburgh Pirates |
Seattle Mariners |
Arizona Diamondbacks |
|
2012 |
Houston Astros |
Minnesota Twins |
Seattle Mariners | |
|
2013 |
Houston Astros |
Chicago Cubs |
Colorado Rockies |
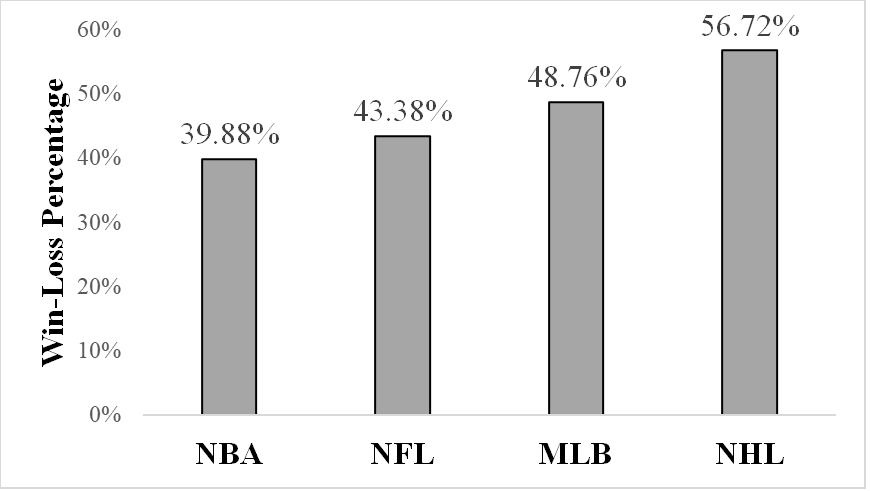
So, what does the data suggest this time? Figure 4 proves NHL teams achieved the highest win-loss PCT in the decade (10 seasons) following a top three draft pick, with a mean of 56.72%. The NBA demonstrated the lowest mean win-loss PCT at 39.88%. Teams such as the Orlando Magic influenced the results, recording the lowest win-loss PCT at 38% after selecting with the second overall pick in the 2013 draft. The MLB demonstrated relatively consistent outcomes, as no team fell below 44% or exceeded above 55% in win-loss PCT. The NFL showed limited improvement in win-loss PCT with a mean of 43.38%. But, more notably, the NFL exhibited frequent turnover among teams selecting in the top three picks, suggesting an effective cycle where the league’s weakest teams achieve competitive improvement quickly. Within the NFL dataset, nine different teams were analyzed which is the highest number across all four leagues included in this analysis. This diversity of teams suggests the NFL’s draft system may more effectively redistribute talent to underperforming teams’ draft analysis.
.
.
Figure 4: Win-Loss Percentage Ten Years After Using Top Three Draft Pick
Win-Loss Percentages by Playoff Seed
Horowitz (2018) outlined a lack of winning for seventh and eighth-seeded teams in the NBA from 1984 to 2017. Using these insights, which lower-seeded teams succeed more in the playoffs and the percentage of times each seed reached the final four over 10 seasons between 2014 and 2023 were determined. This method reveals which league structures provide lower-seeded teams with more equitable opportunities for postseason success, thereby reflecting a greater CB.
Figure 5:Trend in Win/Loss Percentage per Seed in the Playoffs (2014 to 2024)
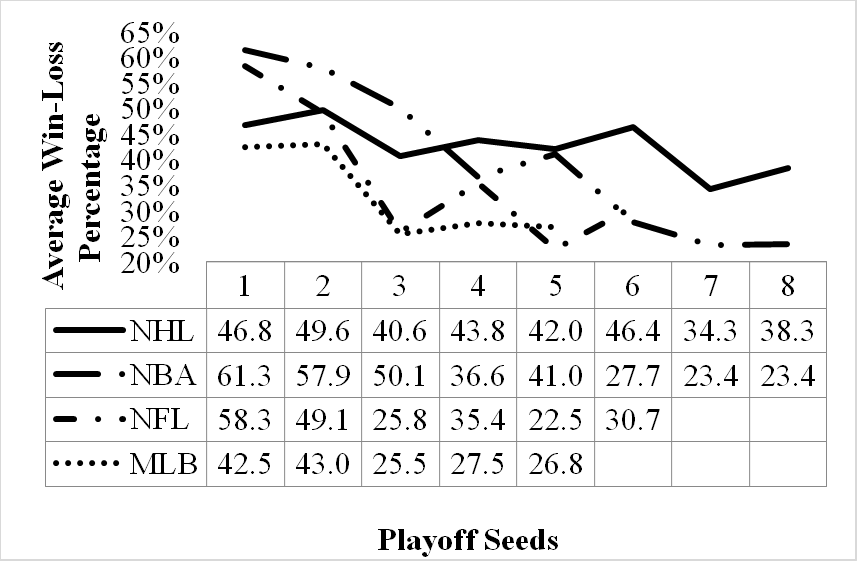
For the NHL and MLB, the second seed achieved more success (in winning games) than the first seed across the ten seasons assessed. Additionally, the fourth, fifth, and sixth seeds in the NHL demonstrated a higher winning PCT than the third seed. The NHL exhibited the most consistent trend of CB, as the range of winning percentages remained relatively stable, with seventh and eighth seeds showing a winning percentage of 34.3% and 38.36%, respectively. The other three leagues analyzed did not show similar performance for their lower-seeded teams. There is a substantial decline in the NFL for teams seeded beyond the top two seeds, as the winning percentages drop by 23.3% from the second to the third seed. Therefore, most playoff success in the NFL derives from the top two seeds. Regarding the PCT of teams reaching the final four by seed (Table 5), there are drastic differences across leagues, particularly for the first seeds.

Measuring Playoff Chances Depending on Payroll
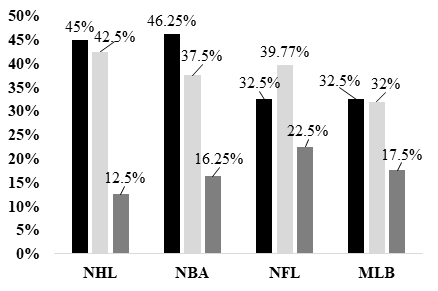
The final method examined the relationship between team payroll and playoff success. Longley and Lacey (2012) found that team payroll did not influence playoff success. Longley and Lacey’s (2012) analysis is extended in the current study by examining whether high-payroll teams consistently qualify for the playoffs, contrary to low-payroll teams. Teams were stratified into three tiers based on their payroll rank, teams with spending in the top tier (ranked first to 10th), teams in the middle (ranked 11th to 20th), and teams in the bottom (ranked 21st or lower, up to 30th or 32nd). The timeframe for this analysis was the 2018/2019 to 2022/2023 seasons (five total seasons were analyzed). This was done to ensure the methods reflect competitive outcomes exclusively under the most recent, stable iteration of the four leagues salary caps and market dynamics, controlling for factors such as revenue disparities and market size advantages. This approach assesses whether specific league structures neutralize financial advantages or allow spending power to remain a dominant factor in competitive success.
In both the NFL and MLB, payroll spending has a negligible impact on playoff probability, with chances staying even across spending tiers. While the bottom tier shows a performance drop-off across all leagues, this is most pronounced in the NHL and NBA. In the NBA, top-tier spending provides a distinct advantage, increasing playoff likelihood by 8.25% over the middle tier; conversely, mid-tier NFL teams reach the playoffs more often than top spenders, highlighting the importance of draft efficiency over payroll maximization. In the MLB, playoff qualification is nearly identical between top and mid-tier teams at 32.5% and 32%, respectively. Regarding championship success, the NHL, NBA, and MLB share similar average payroll ranks for winners (ranging from 6th to 8.6), whereas NFL champions rank significantly lower at 23rd on average.
Figure 6: Chance Of Making Playoffs Depending On Payroll (2018-2023)
Conclusion
- The NHL demonstrates the strongest CB overall – Using four measurement methods (HICB, win dispersion ratio, team dominance, and structural differences), the NHL ranks highest in CB, followed by the NFL, MLB, and NBA. The NHL excels particularly in playoff parity, with 21 different teams reaching the final four over the last decade, the most evenly distributed win-loss percentages across playoff seeds, and the most effective draft system for helping struggling teams return to competitiveness (56.72% win rate in the decade following top-three draft picks).
- In contrast, the NBA suffers from a lack of CB that requires policy reform. This imbalance is evident across several key metrics: the league holds the highest HICB score (outpacing its nearest rival by 42 points), the highest average RSD score (2.61), and the lowest win rate for teams following high draft picks (39.88%). To bolster parity and protect long-term fan engagement, the NBA should consider adopting NHL-inspired reforms, such as more restrictive salary caps and modified draft lottery systems.
- NFL and MLB show mixed results with distinct strengths and weaknesses. The NFL demonstrates strong regular-season CB (lowest RSD score of 1.51) and championship success through efficient drafting rather than spending (average champion payroll rank: 23rd), but its playoff structure disadvantages lower-seeded teams more than the NHL. The MLB produced inconsistent results: while 24 different teams won championships over 50 years (most diverse), the same small group of teams repeatedly reaches the final four, and playoff success concentrates heavily in the top two seeds, revealing a post-season imbalance despite regular-season parity.